London wide questions
1 Where in London is manufacturing taking place?
The type of data we have explored offers different ways to answer this question however there are some limitations. The 4 main data sets have the following general characteristics:
- Directory of London Businesses (SIC) — Point data of ‘financial accounts submissions’
- BRES (employment survey) — Number of jobs per LSOA by Industry (SIC)
- IDBR (business register) — Number of local units per MSOA by Industry (SIC)
- Industrial Land Designations — GLA polygons of Strategic Industrial land (SIL), Locally Significant Industrial Site (LSIS) and NALs (non-designated industrial areas)
Notes:
SIC is ‘Standard Industrial Classification’
A more detailed descritpion of 1, 2, 3 can be seen here https://npalomin.github.io/pnum/MPL.html and 4 here https://npalomin.github.io/pnum/GLA_indLand/GLA_indLand.html
Despite the fact that 1, 2, and 3 represent the same theme; ‘Manufacturing’ according to SIC, the spatial resolution and geometric representation of the data (varying size areas and points) poses challenges for data integration or comparaison.
1.1 Clustered vs dispersed?
Kernel density estimation (KDE) may provide an exploratory tool for hot-spot and cool-spot analysis of SIC point data. However this kind analysis is only exploratory (variations in density will show different results)
More computationally intensive techniques include the analysis of SIC point data (discrete observations) with point pattern analysis to quantify the spatial pattern (Quadrat Analysis, Ripley’s K and DBSCAN)
These last methods can also be used with area data (OAs) to check if manufacturing areas cluster together accross London. Nevertheless, perhaps a visualisation of the point data is sufficient.
1.2 In and around high streets or major street networks?
Space Syntax data can be overlaid on top of Manufacturing POINTS, JOBS per LSOA, and LOCAL UNITS per MSOA
1.3 On designated industrial states? (segragated)
How can these be exactly identified? This ‘atribute’ doesn’t seem to be included in the GLA data set.
1.4 In mostly mixed use environments? (integrated)
Space Synatax data could be used as a proxy
1.5 Along water networks? (i.e. historical path dependency)
This data set has not yet been searched.
1.6 East/west/north/south?
This could be answered with the point data visualization.
1.7 Outer vs inner London?
This data set can be easily obtained.
2 Cartographies
2.1 Manufacturing and Industrial Land
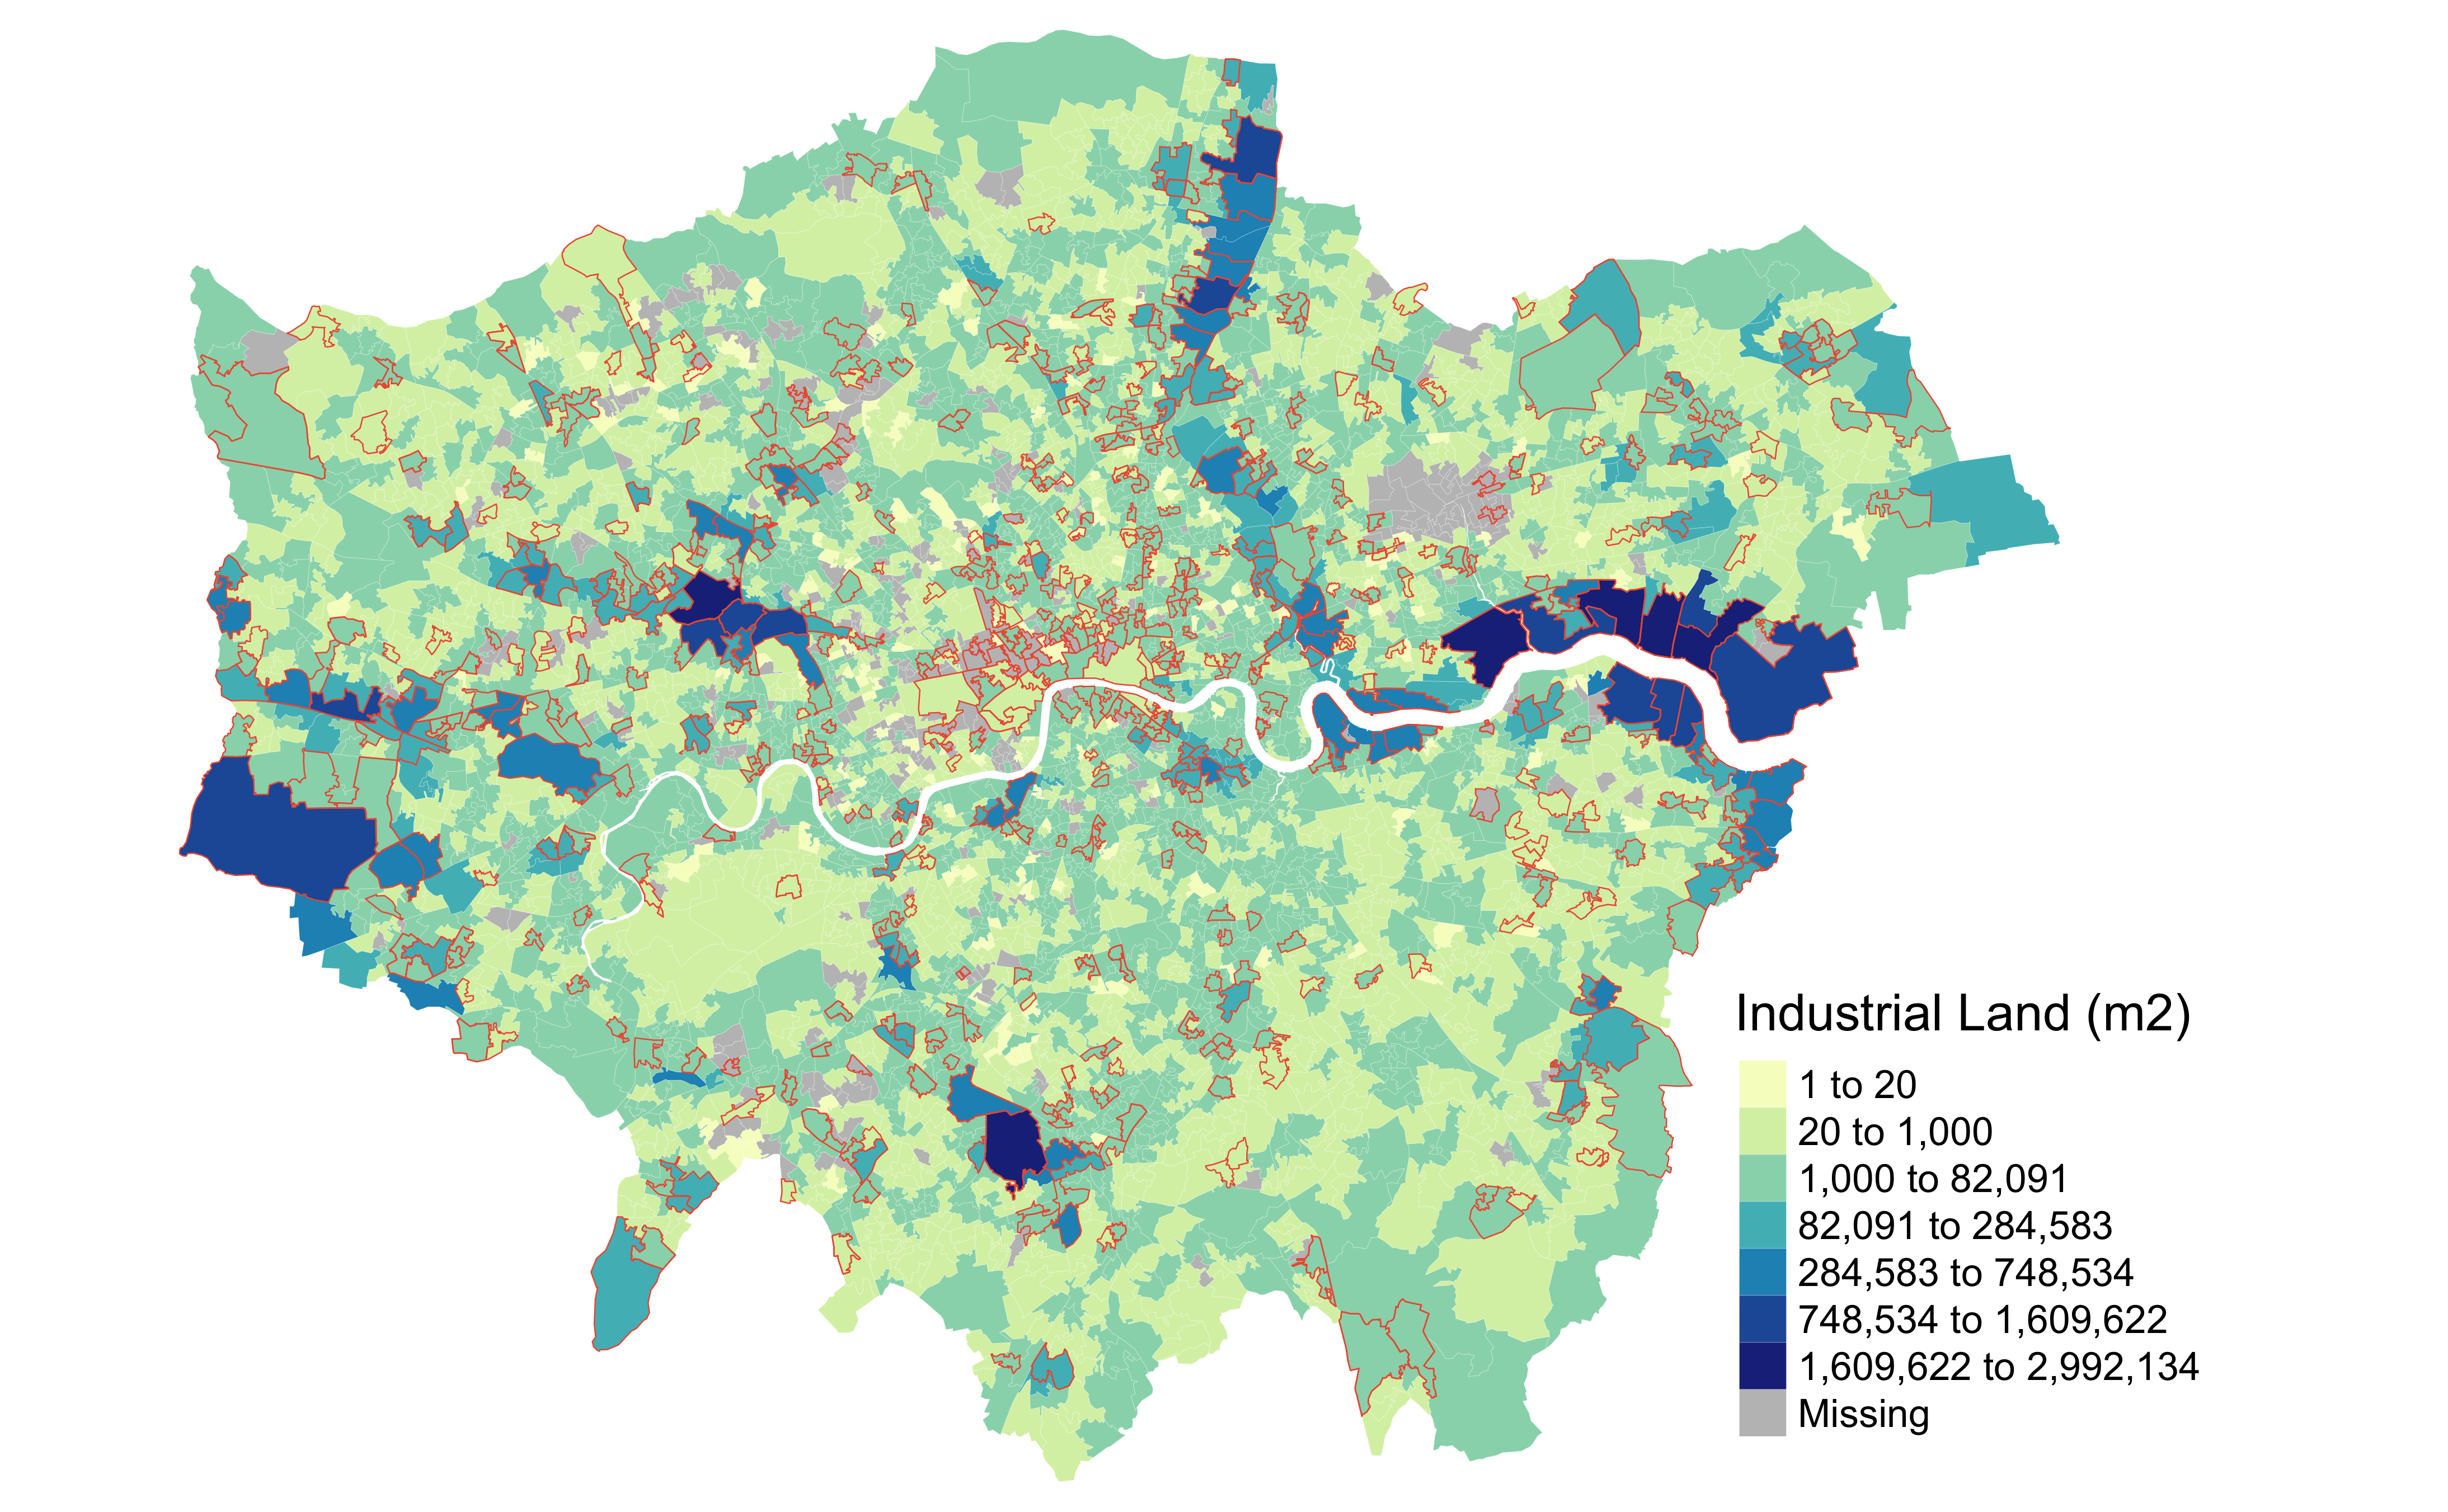
Industrial Land and Manufacturing jobs intensity per LSOA in London
https://npalomin.github.io/pnum/mH.html
The cartographic process considered using QGIS to join attributes by location and calculate ‘Shape_Area’ of Industrial Land Designation per LSOA. The source data comes in a ESRI shape file ‘GLA_Ind_Land_bl_2015.shp’ provided by GLA. The existence pf a ‘Missing’ class could be because some LSOAs don’t have any type of Industrial Land or because of a failure on the geoprocessing in QGIS due to the high spatial resolution of the industrial land polygons. All types of Industrial Land are considered (including NALs). An interactive map deaggregated by type can be consulted here https://npalomin.github.io/pnum/fullA1_m.html
The red borders indicate LSOAs with high number or high percentage of jobs in Manufacturing (4th quartile — number 40 - 6000 units; percentage 6 - 100 %). A more detailed analysis can be found here https://npalomin.github.io/pnum/MPL.html
2.2 Industrial Designated Land by Type
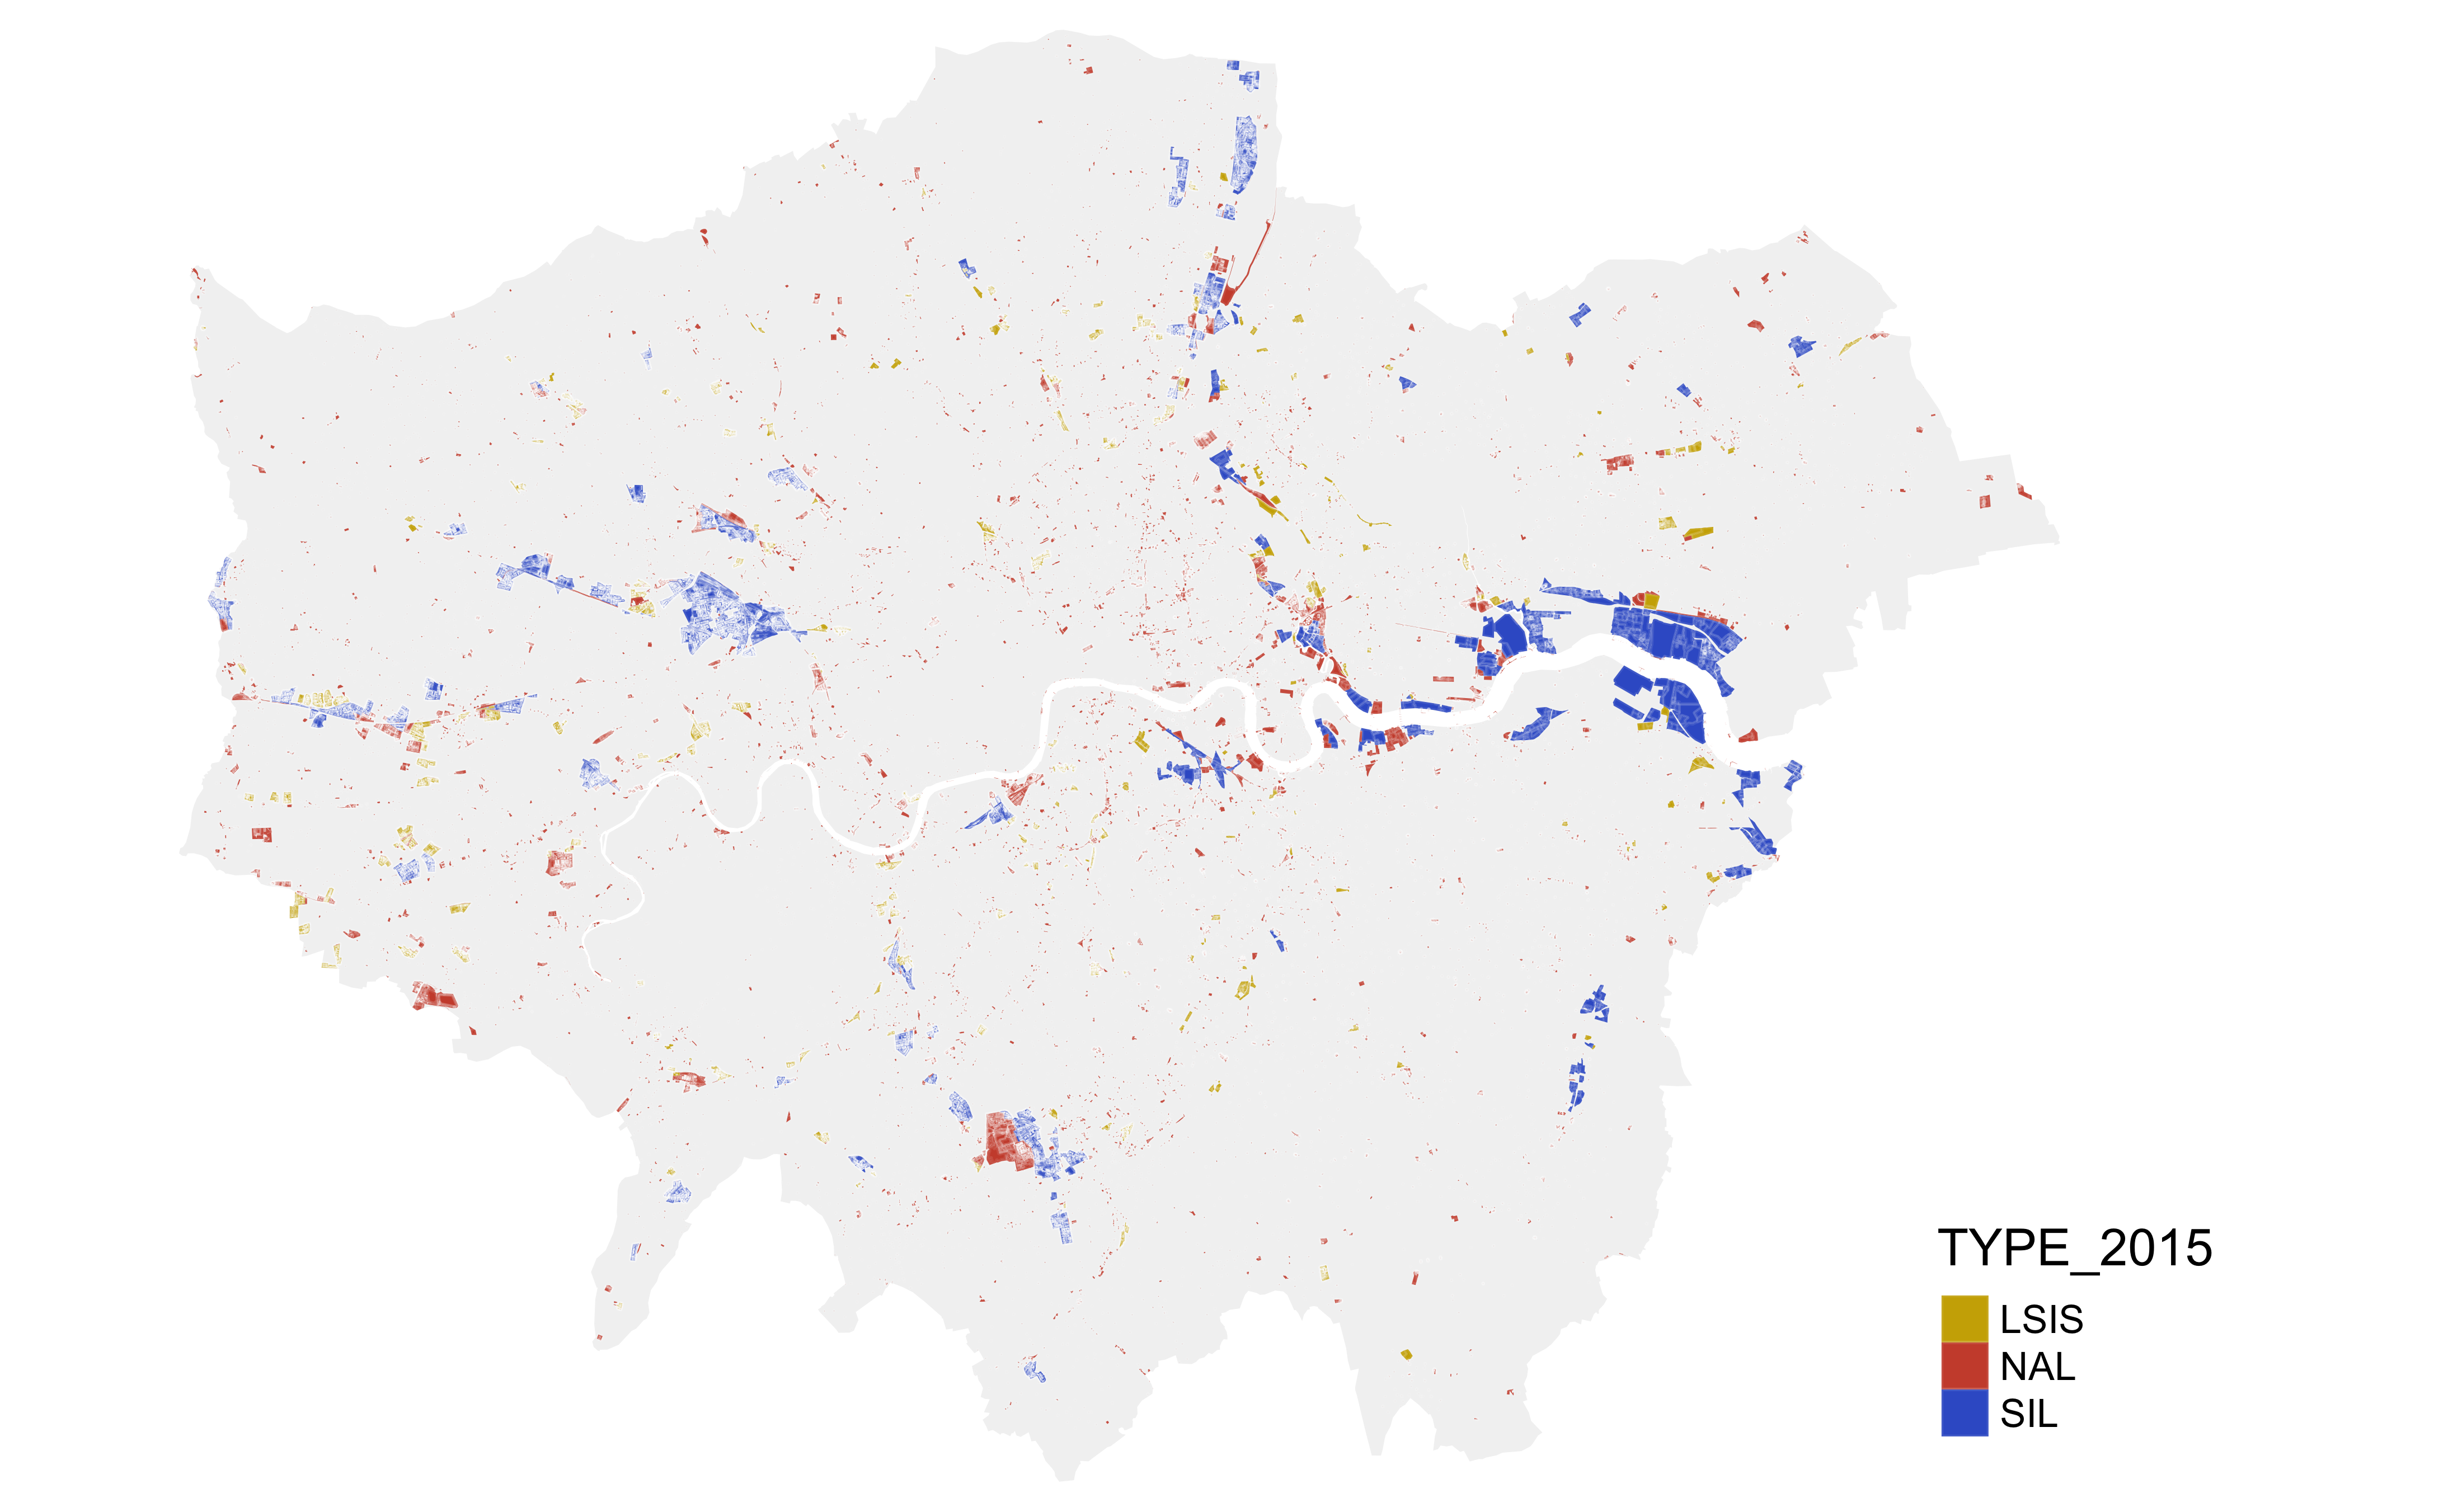
Fine grain information which apparently comes from direct surveys of the built environment (e.g. some roads were identified)
2.3 Manufacturing Local Units by MSOA

A more detailed mapping process description of this map can be seen here: https://npalomin.github.io/pnum/IDBR.html
2.4 London Business Directory — Manufacturing

2.5 Street Network ‘through routes’ (choice 2km) per LSOA

Data downloaded from Space Syntas OpenMapping website. An interactive version of this map with an overlay of count of Manufacturing jobs can be consulted here https://npalomin.github.io/pnum/syntax_interactive.html